DCS 204: Richie’s Reflection Blog
1
Most of my experience working with code has been anecdotal. For instance, my first time in a coding environment was the second project of my Summer internship, where I was tasked with coding a dashboard using R Shiny, despite having no prior experience in R. I was given access to a collection of learning resources and the support of my more experienced colleagues, however, I was mostly on my own in teaching myself how to code in R. Despite encountering several hurdles along the way, the experience as a whole was incredibly rewarding. By the end, I felt like I had gained a fundamental understanding of R and the basics of programming. I’ve continued to sharpen my programming skill set through additional projects in R, SQL, and Python, and I’m excited to see how my self-guided learning of R will translate to more formal projects in DCS 204. I was able to cruise through Lab 1 and was even able to help my partner understand some concepts. The pursuit of learning through trial and error, the necessity of planning, and the ability to triumph despite uncertainty is what I find most rewarding about working with code. I’m excited to continue applying the skills I learned through this project, and now my experiences working with code through several DCS courses at Bates, in DCS 204.
2

When viewing and analyzing the cotton weight data, there are several critical pieces of context to keep in mind. Firstly, it’s important to remember the time during which the cotton was being manufactured and sold. The Bates Mill was founded in 1850 and operated through the 1860s. This was a time in the US when slavery was still legal. Cotton passing through the mill, being manufactured and sold, would undoubtedly have been picked by exploited enslaved people. Secondly, it’s important to remember that the numbers listed in the data are weights. Considering the fact that these quantities, often in the hundreds of pounds, would have been handled by child laborers without advanced machinery puts into perspective the intensive nature of this work. Finally, and following that point, this was also a time in the US when there was no such thing as Child Protective Services. Therefore, there was likely little in the way of safe or fair labor conditions. The conditions in which cotton was produced and manufactured at the time this data was collected were vastly different than those we’re familiar with today. Recognizing these historical distinctions is an essential step toward responsible data analysis.
3
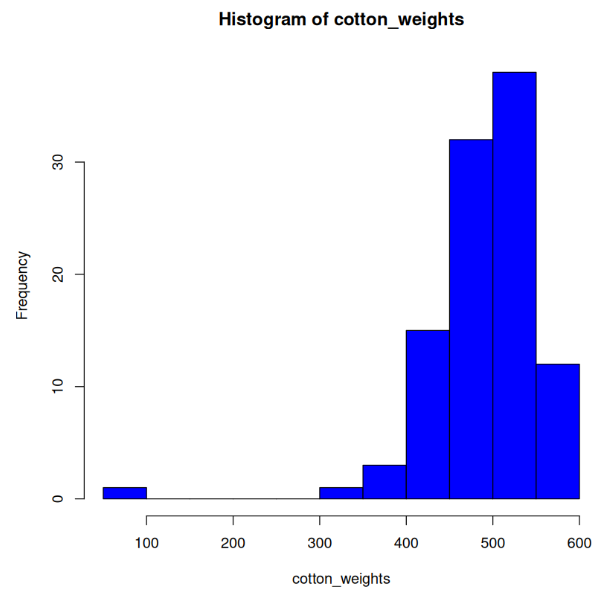
The above histogram depicts the distribution of cotton weights (in lbs) processed by the Bates Mill during the relevant timeframe. I chose to display this data because I was surprised by the sheer quantity of cotton being processed by the mill at this time. Observe that most data falls in the 300-600 lb range. There are several reasons why this is significant: First, cotton is a relatively lightweight material. Several hundred pounds of cotton is a lot of cotton and would have taken considerable time and labor to harvest, transport, and process. Second, it’s important to remember whose time and labor this was. During this time, enslaved people would have been harvesting the cotton, and child laborers would have been transporting and processing the cotton at the Bates Mill. Both cases account for extreme violations of modern-day labor laws and despicable examples of exploited labor. Finally, it’s important to consider the technology of the time and recognize that the tools we have today for the mass harvesting and processing of cotton were not yet available. Instead, enslaved people picked cotton, often with their bare hands, and these heavy bales had to be transported without the assistance of forklifts or other powered technologies.
4
In step 42 of Lab 4, we compared donations made by donors named “daniel” to donations made by donors named “james.” We chose this comparison because the number of times each name appears in the dataset is relatively close (“daniel” appears six times, and “james” appears eight). To evaluate the statistical significance of this comparison, we executed a t-test. A t-test is a statistical test used to determine if there is a significant difference between the means of the two groups. In this case, the t-value of 0.34869 represents the difference between the means of the two groups, standardized by the standard deviation and sample size. In this case, the t-value is relatively small, indicating that there isn’t a big difference between the means of the two groups. Each t-value has an associated p-value, representing the probability of observing a t-value as extreme or more extreme than the one calculated, assuming that the null hypothesis (no difference between the means) is true. A low p-value (typically less than 0.05) indicates strong evidence against the null hypothesis and in favor of the alternative hypothesis (that there is a difference between the means). Here, the p-value is 0.7353, which is relatively high, meaning there is weak evidence against the null hypothesis and that it’s likely that the difference between the means is not significant. In summary, the t-test determined that the difference between donations made by donors named “daniel” and those named “james” was insignificant.
5
A few ideas for data investigations about Bates include the demographics of donors, the industries donors work in, and the college’s expenditure behaviors (e.g., academic versus athletic).
Understanding the demographics of donors and the industries they work in can be important for the college’s fundraising efforts. A data investigation into these factors could help the college to better understand the interests and motivations of its donors, and to tailor its outreach and messaging accordingly.
Additionally, given the recent controversy surrounding the Bates-Colby donation drama, an investigation into the college’s academic-athletic match policy could be particularly timely and informative.
In general, diving deeper into the “whose” and “whats” of Bates financial past and present could help to better inform its financial future.
6
I’ve learned a lot this semester. Most notably, I’ve improved significantly as a reader and notetaker. Longer readings take less time, and I enjoy capturing the key ideas in my notes. Additionally, I’ve enjoyed the opportunity to practice and apply my skills in R. It has been rewarding seeing the concepts we’ve discussed build on one another. Another favorite part of the course has been working on the Labs with my partners. In both cases, I was paired with new people I didn’t know. Learning with and growing together with them was an enriching experience. I plan to continue enjoying this course’s collaborative elements and developing as a reader, notetaker, and programmer in the second half of the semester.
7
Correlation is used to describe the strength and direction of a relationship between two or more variables. For instance, consider the cotton data produced by the class. We can calculate the correlation between Year and Cost Per Pound using the following code:
# Reads Bates Mill Company Financials into a new variable data

data <- read.csv("Bates_Mill_Co_Financials.csv")

# Creates a scatter plot of Year and Cost Per Pound using the plot() function

plot(data$Year, data$Cost.Per.Pound)

# Calculates the correlation between Year and Cost Per Pound using the cor() function and stores the result in a new variable r

r <- cor(data$Year, data$Cost.Per.Pound)

# Squares r

r_sq <- r^2
The above code plots the relationship between Year and Cost Per Pound, calculates the correlation between Year and Cost Per Pound, then squares the result to achieve the proportion of the variation in Cost Per Pound that may be explained by Year.
8
A chi-square analysis is a statistical test used to determine whether there is a significant association between two categorical variables. In this case, the variables being compared were gender and literacy. The categories for gender were female and male, while the categories for literacy were literate and illiterate.
The chi-square statistic for the test was 0.42407 with a p-value of 0.5149. The chi-square statistic measures the difference between the observed frequencies and the expected frequencies. The expected frequencies are calculated assuming there is no association between the variables. The p-value measures the probability of obtaining a chi-square statistic as extreme as the one observed, assuming there is no association between the variables.
In interpreting the results of the test, a p-value greater than 0.05 indicates that there is no significant association between gender and literacy. In other words, the differences in the number of literate and illiterate individuals do not depend on gender. Therefore, there is no significant association between gender and literacy.
9
Skipped
10
Nutritional Awareness and Eating Habits Among Bates Students: An Analysis of Commons’ Bobcat Bar Menu Items
For our final project, Gus and I will examine the nutritional contents of a 10-day period of Commons’ Bobcat Bar menu items, focusing on protein, fat, calories, and other nutritional factors. We aim to analyze the nutritional value of these items and assess Bates students’ awareness of meal nutrition and use of the Commons Menu site.
We will collect data from two sources. Firstly, we will obtain nutritional data for the 10-day period from the Bates College Dining Services website, allowing us to thoroughly analyze each menu item’s nutritional content. Secondly, we will design and distribute a survey to a sample of Bates students via email. The survey will assess their familiarity with meal nutrition, frequency of visiting the Commons Menu site, and demographic information.
Our analysis will involve calculating descriptive statistics for each nutritional feature, identifying the highest and lowest values for each factor. We will also use statistical methods to analyze survey data, exploring relationships between students’ nutritional awareness, Commons Menu site usage, and demographic factors like year, major, or athletic involvement.
By investigating nutritional content and students’ awareness, our project will offer valuable insights into the relationship between students’ dietary choices and their understanding of meal nutrition. Ultimately, our findings could inform future efforts to promote healthier eating habits among the student population.